Score gap
For each opponent, the judge scores both answers to the same question (1–10).
| Opponent | New answer | Their answer |
|---|---|---|
| Model AHuman Elo: 1,000 | ||
| Model BHuman Elo: 1,200 | ||
| Model CHuman Elo: 1,400 |
Against B, the score gap is Δs = 6.3 − 6.1 = 0.2.
NeurIPS 2026 Poster


Language models are often compared by asking people which of two answers they prefer. These votes become Elo ratings: scores that order models by how often they are preferred. Collecting enough votes for each new model is expensive.
An AI model can judge the answers instead. But the usual rating calculation counts only wins, ties, and losses—so a close decision counts just as much as a clear win. The resulting scores can put models in roughly the right order while exaggerating the gaps between them.
Soft-Elo uses the judge’s score difference to estimate human preferences, then feeds those probabilities into the same rating calculation.
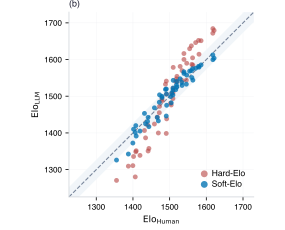
Evaluating new large language models typically requires costly human annotation campaigns at scale. LLM-as-a-judge offers a cheaper alternative, but judge scores carry systematic errors—such as position bias, self-preference, or intransitivity—that can strongly miscalibrate the resulting rankings. We quantify the resulting judge–human disagreement at two complementary levels. At the local level, we estimate per-battle uncertainty from the judge’s own score differences by propagating calibrated win probabilities rather than hard labels into the Bradley–Terry procedure. This estimator, Soft-Elo, brings LLM-derived ratings within 17.9 Elo mean absolute error of human-derived ones when averaged over 55 held-out models on LMArena.
At the global level, we apply split conformal prediction to the residual gap between LLM-derived and human-derived Elo ratings across held-out models, producing prediction intervals with distribution-free marginal coverage guarantees under exchangeability that account for irreducible LLM–human disagreement. Together, these two layers yield a low-cost evaluation tool that provides developers with calibrated Elo estimates and honest uncertainty bounds, without requiring large-scale human annotations for each new model.
When a judge gives two answers almost the same score, its preferred answer is less likely to match the human’s choice. Larger score gaps are more reliable. This relationship is information that a win/loss decision alone discards.
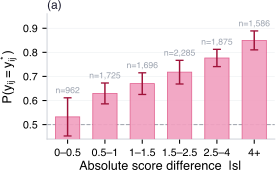
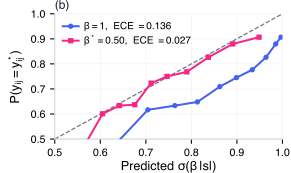
The score gap therefore tells us more than who won: it indicates how much to trust that decision. Soft-Elo learns this link from human votes, using β to convert each gap into a preference probability. It then fits Elo to these probabilities instead of win/loss labels.
For each opponent, the judge scores both answers to the same question (1–10).
| Opponent | New answer | Their answer |
|---|---|---|
| Model AHuman Elo: 1,000 | ||
| Model BHuman Elo: 1,200 | ||
| Model CHuman Elo: 1,400 |
Against B, the score gap is Δs = 6.3 − 6.1 = 0.2.
pj estimates how likely a human is to prefer the new answer over opponent j’s answer.
With β = 0.50, that 0.2-point gap gives a preference probability of 52.5%.
We now find a rating whose predicted win rates match these probabilities. Bradley–Terry links Elo to win rates:
R: new model’s Elo · Rj: opponent’s Elo
Its 52.6% predicted win rate against B closely matches the 52.5% from calibration.
We search for the Elo rating R that maximizes this sum, keeping opponents’ ratings fixed. The usual calculation uses 1 for a win, ½ for a tie, and 0 for a loss in place of pj. Only these comparison targets change.
This gives one estimated Elo rating. AI judges can still disagree with people, so we measure the remaining Elo errors on models with human ratings and use them to set an interval around each new estimate.
Interval example
Higher coverage → wider intervals.
A 90% coverage target means including the human rating for at least 90% of new models on average, under the same sampling conditions as calibration (exchangeability).
Across 55 held-out LMArena models, using calibrated score gaps reduces Elo error for every judge. With less disagreement left between estimated and human ratings, conformal intervals become narrower too.
45.9 → 17.9 Elo mean absolute error, averaged across judges
Across all eight judges, at the same 90% coverage target
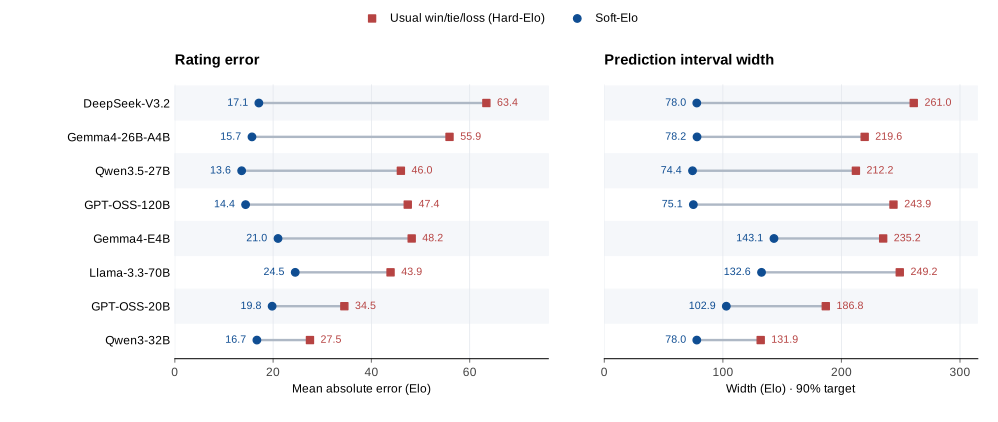
92.1–96.4% observed coverage across the eight judges, against a 90% target.
Model order remains largely unchanged. Soft-Elo makes the gaps between models closer to those measured by human votes, with tighter intervals around each rating.
@inproceedings{kargi2026softelo,
  title     = {From Uncertain Judgments to Calibrated Rankings:
               Conformal Elo Estimation for LLM Evaluation},
  author    = {Kargi, Bora and Salinas, David},
  booktitle = {Advances in Neural Information Processing Systems (NeurIPS)},
  year      = {2026},
  url       = {https://arxiv.org/abs/2606.13221}
}